Tide (re)Play
The tide is the breath of the coast. It fills the marsh and drains it again, and in a hard storm it can take as much as it gives.
It's also the best argument at any dock. Sit at my local watering hole long enough and you'll hear every theory for why the fish did what they did: the moon, the barometer, the wind, and most of all, the tide.
Forward-facing sonar, drones and AI are changing how we find fish. We're not here to hotspot anyone's water. We want you to see the tide itself.
A tide is a place in time. Go back to the same spot at the same time tomorrow and the tide is on a different clock. Turn inland and that clock can change again. We've always wanted to watch the tide move through an estuary on a map, so we could plan the low, the flood, and everything in between.
A full-moon tide, in replay
This replay looks back at the full-moon tide of Friday, August 28, 2026. Full-moon tides bring some of the widest ranges of the month, which makes it a useful day for seeing the wider rhythm of the coast.
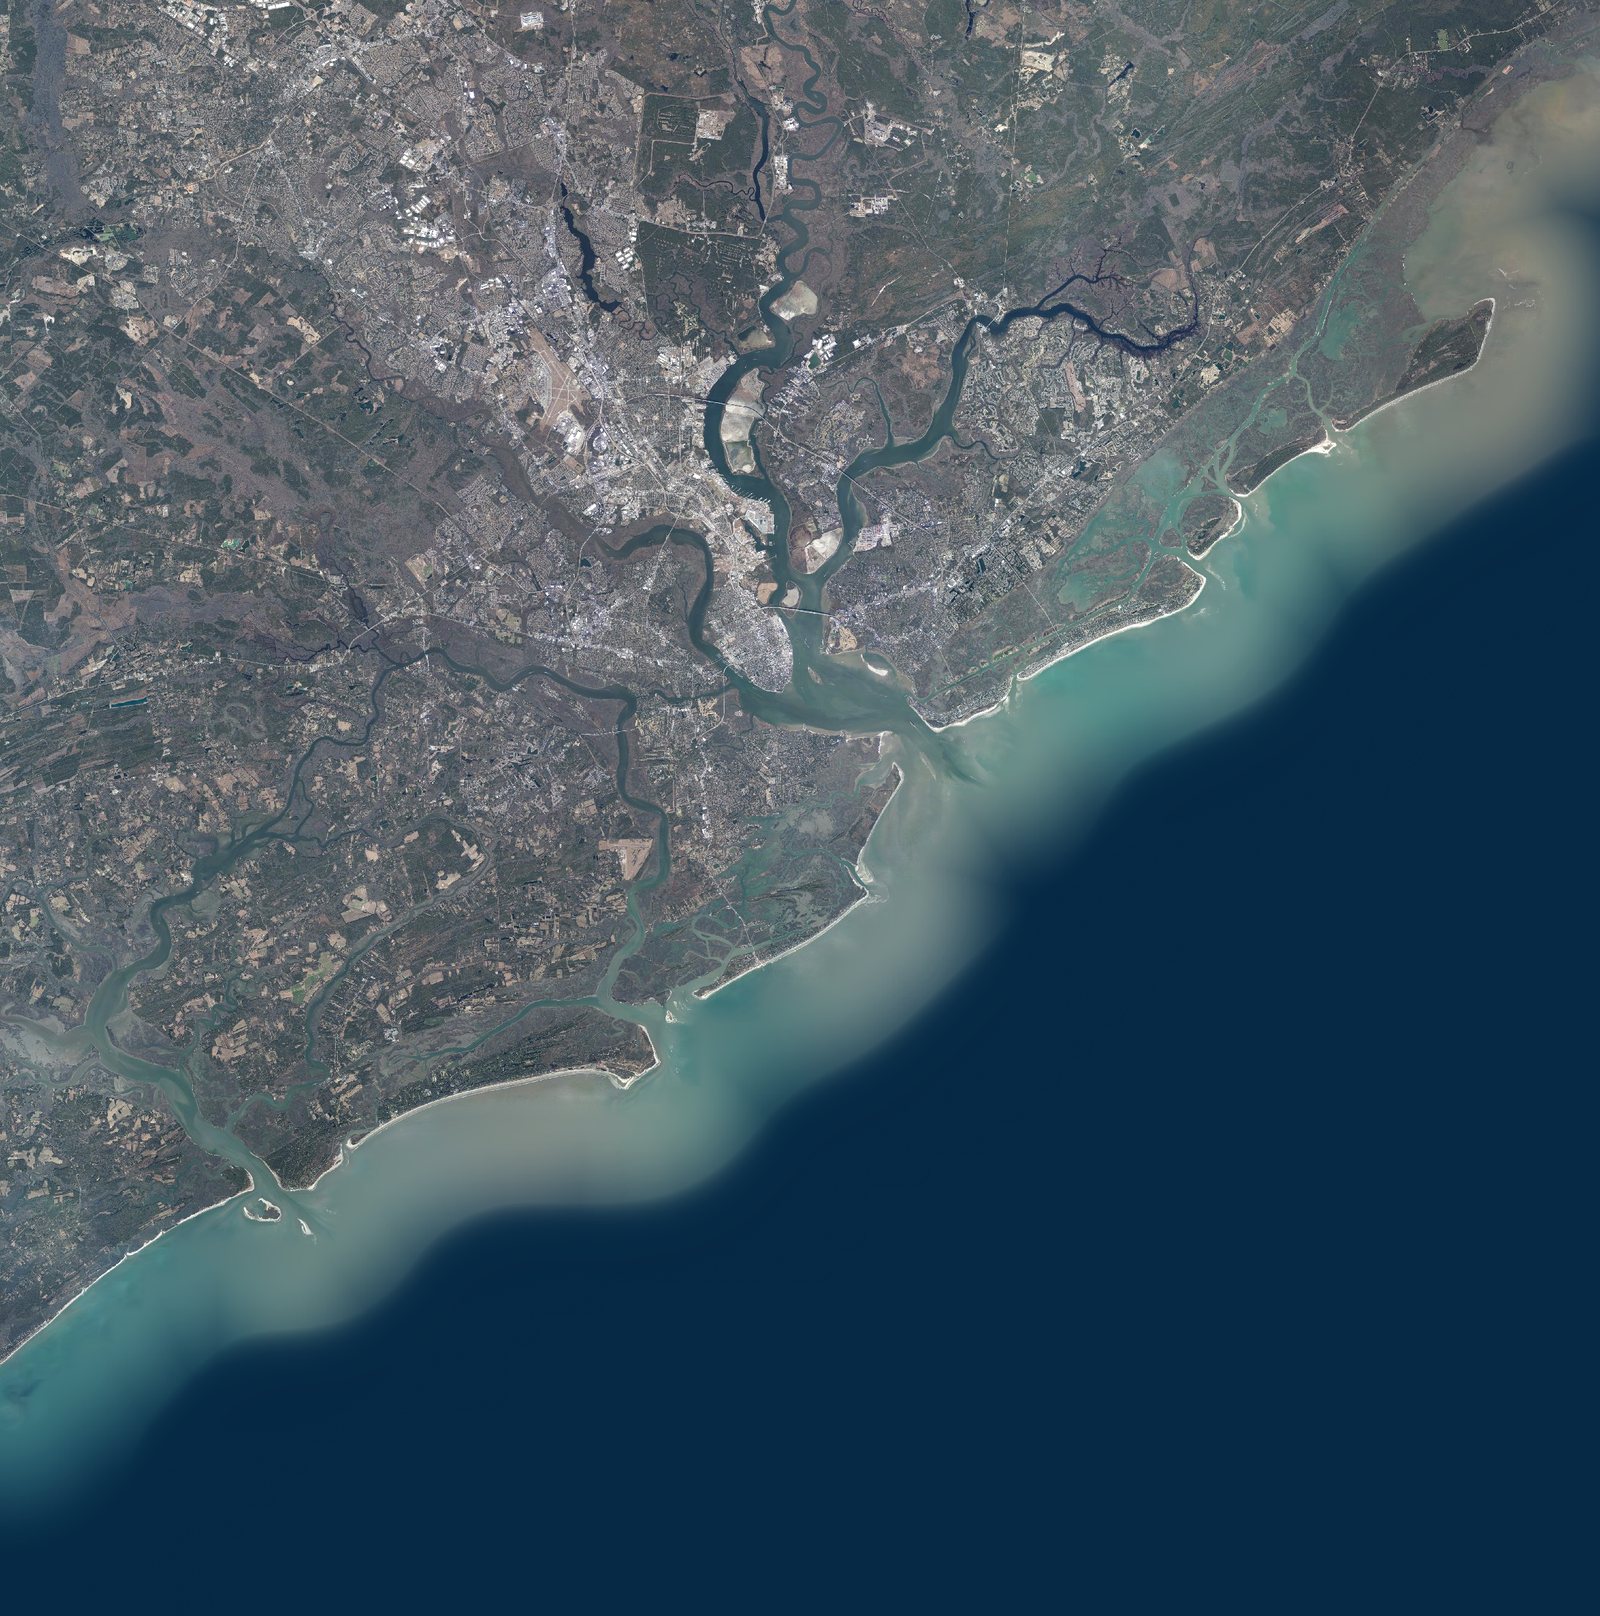
The animation below replays August 28 using tide predictions and the wind and barometric pressure recorded then. It is a reconstruction of that day, not a forecast. A similar tide on another day will not bring identical weather, water levels or arrival times.
- Near high water
- Near low water
- Mid tide (clear)
- High tide arriving
- Low tide arriving
Colors show relative tide stage, not depth or currents. This experimental reconstruction does not establish exact timing or water levels at an unmeasured spot. Imagery: SC Revenue and Fiscal Affairs Office, SC State GIS Coordinator (2023 statewide aerial imagery, Kucera International). Offshore water is shaded, not photographed.
Press Play and follow the white high-water marks from the open coast into the harbor. Amber marks the low-water turn. Mid-tide fades back into the photograph so the turns are easier to follow. Different parts of an estuary can be at different stages at the same moment.
We have kept the view regional. No creek-by-creek timetable, no pins on fishing spots. Watch the pattern, then do your own exploring.
Tide (re)Play, looking back
A tide table gives you the clock at a station. Replay helps you see how the wider estuary responds through the day. For this demonstration, the date stays on August 28. However, if you want up-to-date predictions and actual water levels in one place, check out TidalMap.
Behind the picture are NOAA tide predictions, depth surveys and recorded weather. We are still checking the reconstruction against gauges. A convincing animation is not proof of precise local timing, and this replay does not tell you how much water will be on a particular flat on a given day. Open the chart for current station information.
See you on the flat...
– Greg Barnes
Sources
We are standing on the shoulders of giants. Thank you to the following for doing the hard work before us.
Data
- NOAA Center for Operational Oceanographic Products and Services. Tides & Currents: harmonic constituents, tide predictions and water levels. tidesandcurrents.noaa.gov
- Office of Coast Survey (2026). BlueTopo. NOAA National Bathymetric Source. fisheries.noaa.gov/inport/item/75311
- Tozer, B., Sandwell, D. T., Smith, W. H. F., Olson, C., Beale, J. R., & Wessel, P. (2019). Global bathymetry and topography at 15 arc sec: SRTM15+. Earth and Space Science, 6, 1847. doi:10.1029/2019EA000658
- U.S. Naval Observatory. Dates of Primary Phases of the Moon, 2026. Full moons on August 28 and September 26. Moon phases
Background
- NOAA. Tides and water levels: spring tides and weather effects. Tides FAQ
- Van Ormondt et al. (2025). Subgrid corrections for the linear inertial equations of a compound flood model. Research informing the approach, not the software used for this replay. Geoscientific Model Development